March FOTM: Smart Tile Series – Smart Queue Stats
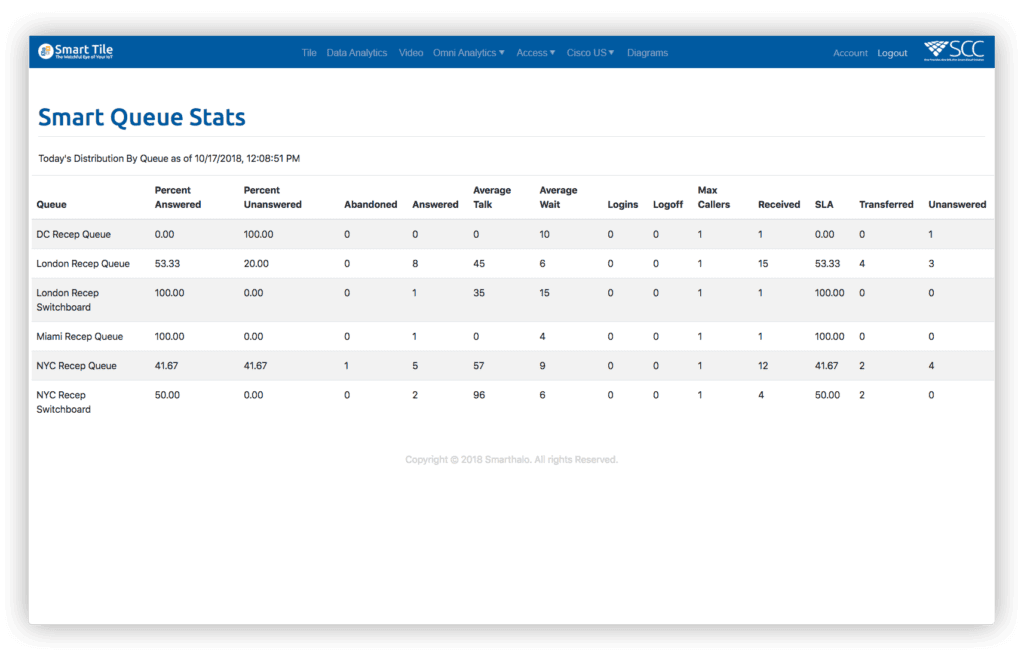
Smart Queue Stats provides a comprehensive view of each call center in a single network. Whether a company employs one customer call center or multiple locations across the globe, Queue Stats displays real-time incoming calling information for each call queue. These live stats include answered and unanswered call totals, as well as the average wait times callers experience while held in a queue. Managers can use Queue Stats to learn which locations are effective, and which may need a few more team members to make sure each caller gets the assistance they need.
The convenient onscreen table shows a real-time information feed for each individual calling centers, including:
- Queue Name
- Answered Call Percentage
- Unanswered Call Percentage
- Total Abandoned Calls
- Total Answered Calls
- Average Caller Wait Time
- Maximum Amount of Callers
- Total Calls Received
- SLAs
- Total Transferred Calls
- Total Unanswered Calls
The Challenge
A growing candy company found themselves facing much higher call volumes as Valentine’s Day approached. While the company had multiple contact centers across different time zones to expand convenient times for customers, they received many complaints about customer service. Both new and potential customers began to send angry emails to the company and create angry posts on social media. Many complained about wait times of up to 30 minutes when calling and being placed in a queue, and often mentioned they had abandoned their calls and hung up before seeking out another company. As the company was losing business and customers in their busiest season, they needed a way to see just what was going on at all their contact centers, and help solve any problems.
The Smart Solution
SmartChoice created a fully customized Smart Tile solution for the candy company, which included the Smart Queue Stats features. The Queue Stats feature provides a comprehensive, real-time display of the company’s three contact centers in New York, Chicago, and San Diego, and the associated call statistics for each one. Managers are now able to see how well each contact center matches up to the previously specified SLA by following a live information feed that displays vital information on incoming customer calls, such as answered and unanswered call percentages and wait times. By using Queue Stats to see which call locations answers the most calls, and which made customers wait and inadvertently force some to hang up, the company determined that the New York and Chicago offices were understaffed. They hired more agents for these centers, and by following Queue Stats’ real-time feed, saw they were able to raise their answered call percentage, lower queue wait times, and focus on maintaining an SLA of 100%. Customer satisfaction grew substantially and after a successful season, the company is confident Smart Tile’s Queue Stats will help them through busy Valentine’s seasons for years to come.