Cloud Cost Optimization: Why nobody can explain the cloud bill
“Nobody can explain the cloud bill, and it only goes up.”
Every month the invoice comes in a little higher. Finance asks why. IT can point at a few new projects, but those don’t explain the whole increase. Nobody has the full answer, so the bill gets paid and the question comes back next month.
The problem usually isn’t that your team is careless. Cloud spend grows quietly, one small leftover at a time, and nobody has the hours to go looking for it. That’s why you need cloud cost optimization.
Where the money actually goes
Most cloud waste isn’t one big mistake. It’s a pile of small ones that keep billing in the background:
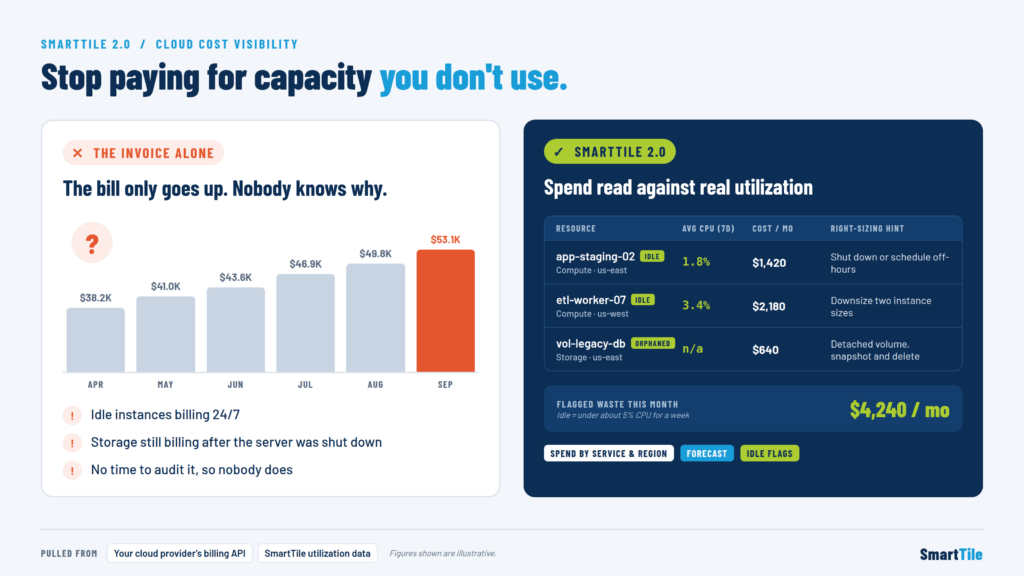
- Idle instances bill 24/7. A server spun up for a test, a migration or a project that wound down keeps running and keeps charging, whether anyone uses it or not.
- Storage outlives the server. Someone shut a server down months ago, but its attached storage is still there and still on the invoice.
- Oversized capacity. Instances sized for a peak that never came, or for a workload that has since moved, keep charging for headroom nobody uses.
Each item looks small by itself. Together, across services and regions, they explain a lot of the bill that nobody can account for.
Why nobody audits it
A proper cloud cost audit means pulling billing data, matching it to real resources, checking utilization for each one and deciding what can go. That’s hours of careful work, and it’s never urgent enough to beat an outage, a ticket queue or a project deadline.
So nobody does it. And the problem gets worse, because the billing data and the performance data sit in different places. The invoice shows what you paid. Monitoring shows what you used. Until you put them side by side, you can’t see the gap between the two, and that gap is where the waste is.
What cloud cost optimization should look like
Good cloud cost optimization doesn’t start with a quarterly spreadsheet exercise. It starts with seeing, all the time, what you’re paying for next to what you’re using.
That means:
- Spend broken down by service and region, so you know where the money goes, not just the total.
- A forecast, so next month’s bill is expected instead of a surprise.
- Spend read against actual utilization, so capacity you pay for but don’t use is obvious.
- Clear, specific recommendations, so your team knows exactly what to change and what it will save.
That’s what SmartTile 2.0 delivers.
How SmartTile 2.0 makes the cloud bill explainable
Spend by service and region, with a forecast
SmartTile 2.0 breaks down cloud spend by service and by region and adds a forecast. You can see what’s driving the bill and where it’s headed before the invoice arrives.
Spend read against real utilization
This is the key difference. SmartTile shows spend next to actual utilization, so you can see capacity you pay for and don’t use. The bill stops being one total and becomes a line-by-line view of cost against real usage.
Idle resources flagged automatically
Anything running under about 5% CPU for a week is flagged as idle. No one has to go looking. The resources quietly adding to your bill show up on their own.
Right-sizing hints with the cost attached
Every idle flag comes with a right-sizing hint and what that resource costs you. Your team gets a clear decision to make, not a research project: here’s the resource, here’s what it costs, here’s what to do about it.
Built on data you can trust
SmartTile pulls cost data straight from your cloud provider like AWS, Azure or Google Cloud, and its own billing API, so the numbers match your invoice. That billing data sits next to the same utilization data that already drives SmartTile’s alerts.
In other words, the metrics telling you a resource is idle are the same metrics your team already relies on for monitoring. There’s no second tool to set up and no separate dataset to reconcile.
It pays for itself
Idle and oversized resources bill every month, so finding them saves money every month too. For most teams, the first month’s savings usually cover the cost of the tier. After that, the savings are yours to keep.
Who benefits most from cloud spend visibility
- Multi-location enterprises running workloads across several regions, where leftover resources are easy to lose track of.
- School districts with tight budgets and lean IT teams that can’t spend days auditing cloud invoices.
- Private equity portfolio companies under pressure to show clear, defensible cost reductions.
- IT leaders who answer to finance and need to explain the cloud bill, not just pay it.
Stop paying for capacity you don’t use
The cloud bill goes up every month and nobody can explain it. Read spend against utilization and the answer is usually right there: capacity you’re buying and not using.
SmartTile 2.0 puts that answer in front of your team automatically. You get spend by service and region, a forecast, idle resources flagged, and a right-sizing recommendation with the cost next to it.
Ready to finally explain your cloud bill? Schedule a SmartTile demo and see your cloud spend next to real utilization.